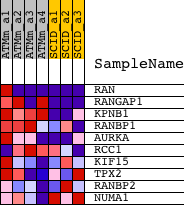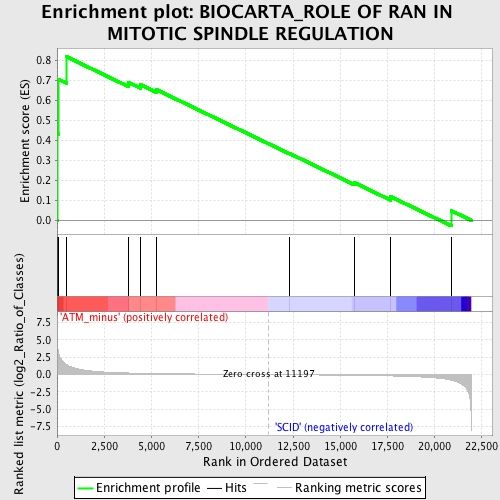
Profile of the Running ES Score & Positions of GeneSet Members on the Rank Ordered List
| Dataset | Set_01_ATM_minus_versus_SCID.phenotype_ATM_minus_versus_SCID.cls #ATM_minus_versus_SCID |
| Phenotype | phenotype_ATM_minus_versus_SCID.cls#ATM_minus_versus_SCID |
| Upregulated in class | ATM_minus |
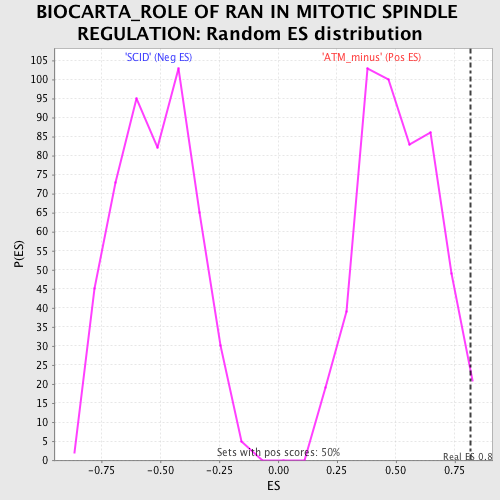
| GeneSet | BIOCARTA_ROLE OF RAN IN MITOTIC SPINDLE REGULATION |
| Enrichment Score (ES) | 0.81830055 |
| Normalized Enrichment Score (NES) | 1.6018267 |
| Nominal p-value | 0.012 |
| FDR q-value | 0.94347167 |
| FWER p-Value | 0.996 |
| PROBE | DESCRIPTION (from dataset) | GENE SYMBOL | GENE_TITLE | RANK IN GENE LIST | RANK METRIC SCORE | RUNNING ES | CORE ENRICHMENT | |
|---|---|---|---|---|---|---|---|---|
| 1 | RAN | 1443131_at 1446819_at 1447478_at 1460551_at | 19 | 4.677 | 0.4353 | Yes | ||
| 2 | RANGAP1 | 1423749_s_at 1444581_at 1451092_a_at | 93 | 2.929 | 0.7050 | Yes | ||
| 3 | KPNB1 | 1416925_at 1434357_a_at 1448526_at 1451967_x_at | 514 | 1.420 | 0.8183 | Yes | ||
| 4 | RANBP1 | 1422547_at | 3765 | 0.228 | 0.6914 | No | ||
| 5 | AURKA | 1424511_at 1440129_at | 4427 | 0.186 | 0.6785 | No | ||
| 6 | RCC1 | 1416962_at | 5264 | 0.147 | 0.6541 | No | ||
| 7 | KIF15 | 1431718_at | 12311 | -0.024 | 0.3350 | No | ||
| 8 | TPX2 | 1428104_at 1428105_at 1447518_at 1447519_x_at | 15751 | -0.111 | 0.1885 | No | ||
| 9 | RANBP2 | 1422621_at 1440104_at 1445883_at 1450690_at | 17660 | -0.192 | 0.1194 | No | ||
| 10 | NUMA1 | 1423974_at 1423975_s_at 1441090_at 1444576_at 1444577_x_at | 20890 | -0.810 | 0.0477 | No |